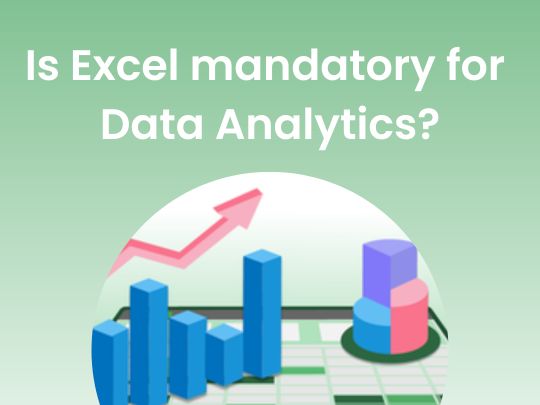
An Excel certification is one of the best ways to show employers you have a good foundation in that area. However, most people wonder whether data analysts need such certifications to land a decent job.
Learn the core concepts of Data Analytics Course video on Youtube:
How data analysts utilize Excel
Data analysts are responsible for analyzing data sets to find patterns and trends. These findings offer precious insights, which are, in turn, used in the decision-making process. Data analysts use different programming languages, tools, and applications to visualize and analyze data. These include Excel, python, and Tableau. Excel is a core application that data analysts use.
With Excel, data analysts can perform all sorts of tasks. They can create sparklines, highlight figures, format data into tables or charts, and handle fast analysis. With Excel, professionals can retrieve complex data and customize fields or functions for more straightforward calculations. In addition, Excel can be used to visualize and analyze segmented data without other software. This makes it a good tool for sharing information.
Check out 360DigiTMG’s data analyst classes in Pune, and other regions of India and become certified professionals.
Excel tools that data analysts can use
- VLOOKUP: it retrieves information and combines data sets
- PivotTables: it makes it possible to aggregate data to isolate a part of it without manual filters
- FIND/SEARCH: the function isolates and extracts information from large data sets
- CONCATENATE: this formula combines texts, numbers, and dates from different cells into one cell. It can be used to create Java queries and API endpoints.
- Text formulas: these are functions such as substitute, left, and right used to separate a text volume from large data sets
- Macros: these are actions that automate Excel tasks and need to be performed repeatedly
- Conditional formatting: it sets apart the essential and less critical data on the spreadsheet
- SUMIFS: allows analysts to come up with criteria and sum up values within a range that satisfies the criteria
- Analysis ToolPak: makes it possible for analysts to handle all sorts of statistical testing from Excel.
Microsoft excel certificate
With a certificate, you indicate you have all the necessary skills to work on different Excel workbooks or worksheets. For example, such a certification shows one can handle data analysis on all sorts of spreadsheets and develop pivot tables. Individuals can also use VBA to create macros that can handle repetitive tasks. These are tasks that data analysts need to use every day.
To get certified, an individual must complete different tasks within a given time limit using set clicks on a keyboard. Such limitations show that an individual is conversant with the Excel interface well and therefore does not have to scroll through toolbars and menus to handle a task. This also indicates that the person tested can use Excel to handle a real-world and fast-paced environment.
Do data analysts need the certification?
Certification levels cover core analytic concepts like conditional formatting, pivot tables, and macros. Such a certification lets employers know whether the applicant is proficient in different analysis features.
One thing to note, however, is that many data analysis jobs don’t need Excel certification. However, having proficiency in Excel candidates can be an application prerequisite. Excel is not essential for many data analyst positions, but you require a deep understanding of the spreadsheet application and working knowledge of the different functions and formulas. You should also be aware of all its data visualization capacities.
Is Excel a good option?
This spreadsheet program has been used for decades and still holds great value. Many new capabilities have been added, and things look better than initially. Even though some people consider these spreadsheets outdated, they are still relevant. While there are other better solutions for all sorts of projects, it is still one of the most affordable and reliable tools for data analytics. In addition, it is a great foundational structure, especially for intelligent data, since it deepens one’s understanding of the whole analytics process.
Most businesses and industries still emphasize how important skills in Excel are because Excel is an intelligent way of extracting the most actionable insights. For example, we can analyze marketing trends, operations, and revenue patterns using Excel spreadsheets.
Larger corporations have moved from this spreadsheet type to applications that can handle big data. However, spreadsheets still find use in many areas. In every cell of an Excel spreadsheet, there are data points. Raw data such as units sold, SKU, sales date, and so on can be imported or entered into the spreadsheet to make it easier to organize and view. A good spreadsheet needs to organize raw data into a readable format, making it easy to extract insight. If data is complex, excel allows functions and fields customization for easy calculations. With larger data sets, segmented data is easy to study and visualize without any other software. Excel will not build a data product full scale on its own, but it can present visualizations that are easy to read and offer accurate calculations.
If you want to be a data analyst or need to handle data to formulate reports, you should appreciate that data analytics is not the most straightforward area. You cannot understand it in only one sitting. Instead, you should take advantage of spreadsheets as they are a version of how larger projects work.
Applications
Excel spreadsheets can be used in different internal applications. For example, it can be used to timeline and budget projects. With it, it is easy to develop simple dashboards that are easy to operate, and orders can be easily tracked. Spreadsheets can fulfill some specific needs and are a great choice if you are looking for a visual aid. Data analysis aims to create the most cohesive narrative easily achieved with Excel.
Some organizations use Excel to create models, import data, and catalog data sets. However, so much more can be achieved with this program. There is an excellent chance that Excel will keep changing, and with time, it may be able to handle bigger data sets.
Data Science Placement Success Story
Organizations rely on available data to build conclusions after it is processed. When the available data is analyzed, it becomes easier to move to other levels in a project, such as design or development. When the analysis is good, you will get better products. Excel falls under data analytics tools but doesn’t always act as a complete solution. You can use other functions to explore the available data for even better insights. For example, excel allows us to clarify our working datasets.
Browse Other Courses
- Artificial Intelligence Course in Pune
- Business Analytics Course in Pune
- Cloud Computing Course in pune
- Cyber Security Course in Pune
- Data Analytics Course in Pune
- Digital Marketing Course in pune
- Ethical Hacking Course in Pune
- IoT Certification Course Training in Pune
- Machine Learning Course in Pune
- PMP® Certificate Course in Pune
- Python Course in Pune
- Tableau Course in Pune
Navigate to Address:
360DigiTMG – Data Analytics, Data Science Course Training in Pune
No. 408, 4th Floor Saarrthi Success Square, near Maharshi Karve Statue, opp. Hotel Sheetal, Kothrud, Pune, Maharashtra 411038
089995 92875
Get Directions: Data Science Training In Pune


